How to build a good churn survey
Step by step, from "meh" to "oh oh" to "ooooh"
Hi, my name is Leah. I specialize in honest and realistic, scaling go-to-market motions of tech companies in B2B SaaS in a no-bs way that understands growth as a holistic executive challenge, not a marketing or product function.
I’m all about product-led growth and sales to build trust with markets that are as cost-efficient and scaleable as possible.
Want to sponsor this spot? Drop us a line for the Mediakit: sponsoring@productea.io
Churn is the one thing you should get under control in B2B. It guides you very specifically, with quantifiable proof of what you should fix now and what you should fix later. Yet many companies and PMs underinvest in this critical tool.
There are some good pointers out there about what questions to ask, but I haven’t seen anyone specifically discuss how to get “started” with a good, clean churn survey to understand what’s up in your business. It’s not just the questions you could ask but also the process of getting there.
Let me show you how I approach it with my teams most of the time:
Understanding churn:
involuntary vs voluntary
2nd level categories
Your first iteration
Your 2nd, 3rd iteration
Common problems & Bias
Understanding churn: involuntary vs voluntary
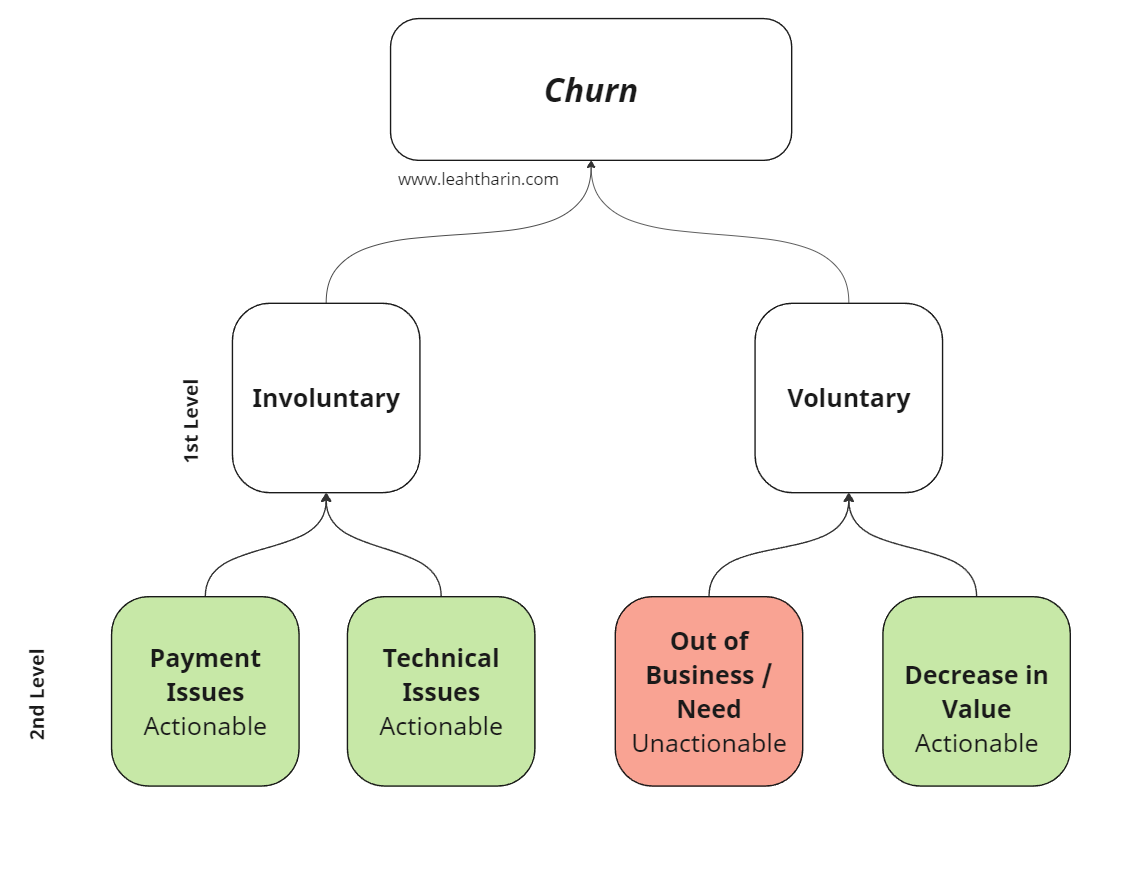
First, we need to understand the general concept of churn categories. Let’s keep it simple: The most basic way to understand churn is to separate it into voluntary and involuntary churn first.
(You see this commonly pop up in financial reports of companies to the board/investors)
Voluntary Churn:
Voluntary churn is driven by customer choice
It occurs when customers actively decide to stop using your product or service.
Reasons can include dissatisfaction, better alternatives, pricing issues, or no longer needing the product.
Involuntary Churn:
Involuntary churn results from external or technical issues
It happens without the customer's intention to leave.
Often due to failed payments, expired credit cards, or technical issues.
Understanding Churn: 2nd lvl Categories
Our questions and analysis should capture both of these dimensions, for instance:
Did the customer cancel the subscription because they couldn’t pay anymore? (we should see this in our data with failed payment attempts, which are closely followed by the customer canceling automatically, but we can also ask directly) → Involuntary
Did they go out of business or lose the underlying need for other reasons? → Voluntary
But we should go one level deeper before we start; let’s go further with Voluntary churn first:
Out of Business vs. Decrease in Value
Most answers you’ll get on voluntary churn can be summarized in two subcategories:
“Out of Business / Need”:
Those are dependent on your vertical. Some martech sellers, like RB2B, report a high percentage of customers who fall into this category compared to what you would expect in other categories.
We need to know about this bucket because they are unactionable for our product. There’s not much you can do there unless you have a specific way of making them so successful that they stay in business because of you alone which is unlikely.
Going out of business will show up in your surveys as “voluntary churn,” but you could argue that it is involuntary (external circumstances force your customers out). The involuntary churn we usually refer to is the one that we can do something about. (see next sections)
“Decrease in Value”
This is where the meat is for the product regarding voluntary churn. Customers in this bucket will give you valuable feedback on what you can improve. If 50% of all respondents mention this as their main reason… you have a problem, Houston. But a problem you can work on.
Payment vs. Technical Issues
Most answers you’ll get on involuntary churn can be summarized in two subcategories:
“Payment Issues”
This one is usually big. It includes fraud, payment problems, insufficient funds, credit card limits, and renewal… and they are usually quite actionable for your product.
Shout out to all the payment growth teams dealing with this very difficult topic. It usually involves dealing with payment providers who are always annoying to deal with. Always. (Please Paypal and Stripe step up your customer support game)
“Technical Issues”
Server timeouts, script errors are obvious problems in any product and they are impossible to avoid to some degree. But inside them you will also have technical issues at the wrong time. A server outage at the moment where customers try to pay is weighing heavier in a downmarket segment (see later) than an outage that happens every week for heavier workflows (bulk features etc.).
Unfortunately, this is where things can get a bit murky. At what point is it involuntary (forcing the customer out) vs. decreasing the application's value over time? Those can go hand in hand. Either way, you can do something about it, as we’ll see later.
Technical issues are also part of the reason why I don’t pay too much attention inside product on the split between involuntary vs. voluntary but on the 2nd level categories alone.
(More on this later in the “The 20% / 3% refinement: the second iteration” section)
An interesting one I encountered once was a broken “reset password” flow, leading to customers canceling in droves over the phone/chargebacks as a result. Customer support knew, of course, that problem, but no one quantified it holistically in a survey, and at that point, it’s difficult to say whether it was voluntary or involuntary (and also not helpful)
The lesson here is that you don’t want to learn about technical issues from your churn survey first. If you do, there’s been something seriously broken for a long time. Maybe it’s time to monitor issues before the customers take the phone into their hands.
Let’s get started: the first iteration.
Generally, these are the 4 categories that I cover in the first iteration of my survey, which will be very, very basic; let’s see what a survey could look like:
Have one question to cover each category, keep them clearly separated, and include an “other” option.
Then we run the survey with some customers who churn and gather some answers and refine it now based on the answers:
(See last part on some suggestions on form, data, vs in-app, vs email etc.)
The second iteration: 20% / 3% refinement
This is a simple, useful rule:
Whenever I see an answer that gets more than 20% of answers, I subsegment (to the 3rd level) it until it stops getting more than 20%.
Questions that get underrepresented (less than 3%) get kicked out to keep the churn survey lean (see “length of survey”)
Dominant “Decrease in Value” or other main categories
If your result looks like this, it’s obvious what we have to do:
Introduce subcategories for decrease in value. For instance:
Value: Too unstable
Value: Poor Customer Support
Value: Found a better solution → Competitors can only acquire your customers if they are vastly better than you. Most people don’t churn for a marginally better solution due to switching costs and friction, especially in B2B.
Again, include an “Other” option; at this 3rd level, reasons can become tricky. It’s a good failsafe.
Hint: Including a question asking for “too expensive” is tricky, price is inherently a different word for “decrease in value”, I try to avoid it, but it can help to start experimenting with price.
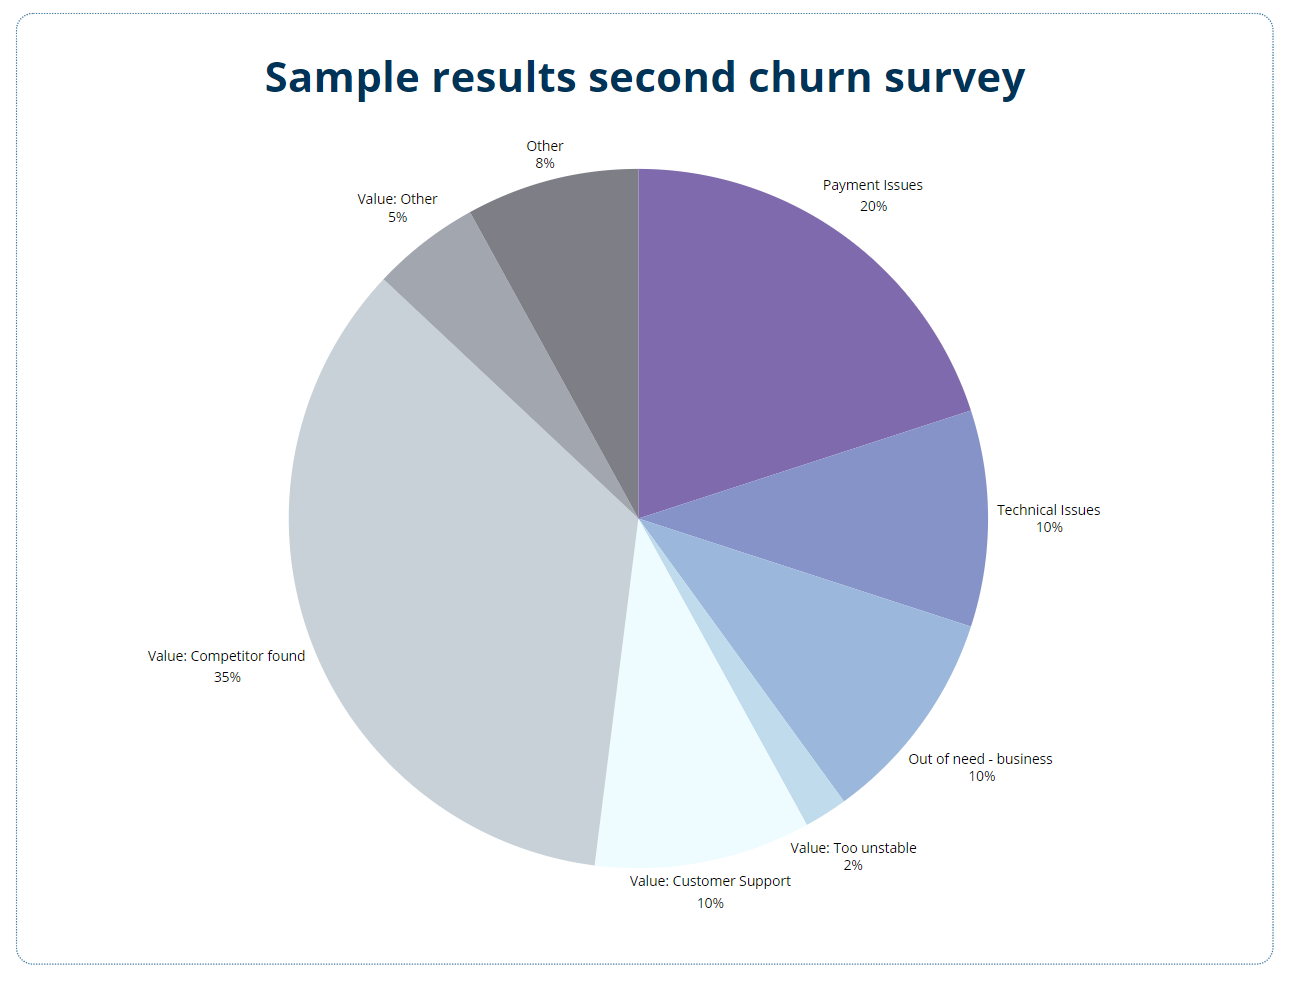
Run it again, and you might see a new result like:
The “Competitor found” answer is still dominant (35%), and the Value: Too Unstable answer is underrepresented with 2%. We repeat the exercise by sub segmenting the question with the competitors and drop the question about the product being too unstable.
And so forth and so forth.
For the above finding, you’re probably getting disrupted, and your surveys would typically look like this if another player is eating your lunch. Big publishing houses dealt with this picture when people constantly left them for cheaper, easier-accessible publications. We refer to this as a red queen hypothesis, and it’s visible from this churn survey picture alone.
Dominant “Other”
Your survey might have a dominant “Other” category:
This is why we include an “Other” option. In rare cases, something else is happening, or your survey is badly structured, confusing, and unclear.
Since we include a free text form in the survey (in other:____), we can now use language models to categorize the qualitative feedback as much as possible and potentially create a new question to reduce the number of selections that come from “Other” until they drop in share if we see a good cluster.
Common problems & form
There are some problems that you might encounter, people who answer your surveys are always only a sample of a very specific group that has churned and the form you’re asking your questions also influences your data set, lets look at them bit by bit:
Good Churn
Upmarket vs. Downmarket
Length of Subscription
Length of Survey
Forcing customers to answer
Form: Existing data-only analysis
Form: Exit in-app survey
Form: Email survey
Form: Qualitative surveys


